In my previous article about logging I didn’t really dig the semantic/structured logging. ETW was a bit complicated for my needs and the benefits of structural logging are not obvious with logging sinks like text file or SQL database. I gave it a shot with Serilog and Elasticsearch, and liked it a lot more.
Configuration
The first step is to install Elasticsearch. Elasticsearch is an open source, distributed, RESTful search engine (that feels like a NoSQL database with powerful search and analytics capabilities). Its installation is pretty straightforward. The only thing I needed to do additionally was to install Server JRE and to configure a JAVA_HOME system variable.
Then you add Serilog and a sink for Elasticsearch to your project. Serilog is a popular .NET logging library that supports structured logging. Getting them from NuGet:
Install-Package Serilog
Install-Package Serilog.Sinks.ElasticSearch
Creating a logger instance:
var logger = new LoggerConfiguration()
                .WriteTo.Elasticsearch(new ElasticsearchSinkOptions(
                new Uri("http://localhost:9200"))
                {
                    AutoRegisterTemplate = true
                }).CreateLogger();
For production projects I’d additionally create a wrapper around it and put it in some IoC container.
Writing a log
After the configuration is finished writing a log entry to ElasticSearch boils down to just:
logger.Information("User {userId} made an order for {orderAmount}", userId, orderAmount);
Looks very similar to any other logging library, doesn’t it? However unlike most other libraries userId and orderAmount are not going to be formatted to string directly, but captured as separate meaningful values. They become fields by which you can index, search and sort. That’s the main benefit of structural logging.
Log analysis
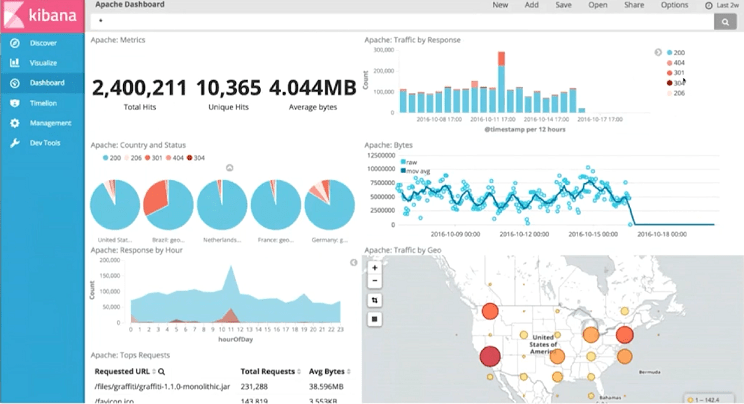
Elasticsearch would be a lot less attractive without Kibana. Kibana is a powerful visualization platform on top of Elasticsearch. It allows to visualize and analyze your data with different graphs, charts, maps etc.
There are situations when you have several logs and you want to aggregate data from them for analysis. For example in my current project I have at least three logs: Audit log for requests and responses (it’s a WebApi application), Sync log for requests to external SOAP services and a general application log. They are written to SQL databases. You have to write a UNION query on several tables with different schemas to get a general picture of what’s going on in the application. To achieve the same in Kibana you just need to name your Elasticsearch indices with a pattern - some common prefix.
Another helpful thing here is to use a RequestId through out your logs. You can generate a unique RequestId in some early stage of the request pipeline (HTTP module, Middleware, ActionFilter) and then include it in each log entry in different logs. This allows to see everything that have happened during a particular request - request body, corresponding response, exceptions and any other events.
In conclusion you can have a great logging system with Serilog, Elasticsearch and Kibana. And all this goodness works in .NET Core also. Too bad getting this to production servers through my management and client sysadmins is more difficult than actually developing this solution :)