Last time we looked at how and why you might want to write your application logs to Elasticsearch. But Elasticsearch is a great tool for many logging, monitoring and analytics cases. This blog post is an introduction to how Elasticsearch can help you analyze almost any data source, for example, your web server logs.
Logstash
Logstash is a general purpose ETL (Extract-Transform-Load) tool, consisting of many inputs, filters and outputs. It’s a part of so-called Elastic Stack. Logstash helps you to put your data from different sources into Elasticsearch.
There’s a good chance you are running you application in IIS if you are a .NET developer. There are many tools to analyze IIS logs, but I haven’t seen anything as powerful as Elasticsearch. Analyzing your IIS logs with Elastic Stack might be especially interesting for you if you already use it for your other logs.
I don’t want to repeat the general guidelines from many existing articles on how to use Logstash. The most important part there is Logstash config file. The most important part in the config file is the filter step. Here’s my filter config:
## Ignore the comments that IIS will add to the start of the W3C logs
if [message] =~ "^#" {
  drop {}
}

grok {
  match => ["message", "%{TIMESTAMP_ISO8601:log_timestamp} %{NOTSPACE:s-site} %{WORD:cs-method} %{URIPATH:cs-uri-stem} %{NOTSPACE:cs-uri-query} %{NUMBER:s-port} %{NOTSPACE:cs-username} %{IPORHOST:c-ip} %{NOTSPACE:cs(User-Agent)} %{NOTSPACE:cs(Referer)} %{NUMBER:sc-status:int} %{NUMBER:sc-substatus:int} %{NUMBER:sc-win32-status:int} %{NUMBER:time-taken:int}"]
}

#Set the Event Timesteamp from the log
date {
  match => [ "log_timestamp", "YYYY-MM-dd HH:mm:ss" ]
  timezone => "Etc/UTC"
}

geoip {
  source => "c-ip"
  target => "geoip"
  add_tag => [ "iis-geoip" ]
}


useragent {
  source=> "useragent"
  prefix=> "browser"
}

mutate {
 remove_field => [ "log_timestamp"]
}
It should match your IIS log fields configuration. Mine worked great for the default IIS log fields configuration on Windows Server 2012. Use Grok Debugger to troubleshoot it.
A killer feature of Kibana for me was the ability to visualize the geography of requests to the server:
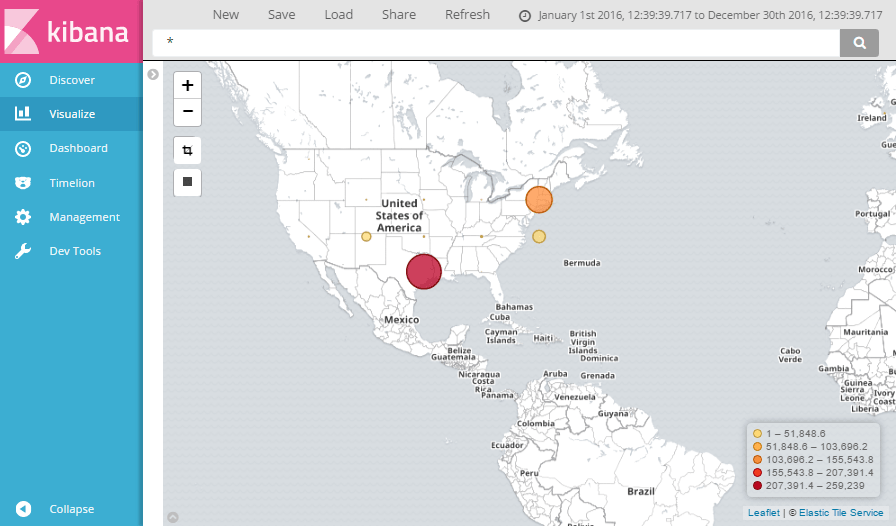
Notes:
Elasticsearch and Logstash are quite resource-consuming. That’s why it’s better to install them on a separate server and to use Filebeat to ship logs from your web server machine(s).
Another interesting trick for real-time log analysis in high-load systems is to use ETW. In IIS Manager Logging section change Log Event Destination to ETW. This will create ETW events that can be captured by some windows service and written directly to ElasticSearch. This solution is a bit more complicated, but it allows to avoid writing logs to disk and their subsequent parsing.
When I tried to visualize my IIS logs in Kibana I got the following error:
"Trying to query 1355 shards, which is over the limit of 1000. This limit exists because querying many shards at the same time can make the job of the coordinating node very CPU and/or memory intensive". By default Logstash creates one Elasticsearch index for each day (IIS log file) and 5 shards per index. I resolved the issue by decreasing the number of shards per index. This is configured in index template.